
The Baseball Killshot
Analysis of the Baseball Killshot and Some Useful Terminology

If you follow college basketball at all, you have probably heard of the “Kill Shot”, which was coined by Evan Miyakawa. In this article, he explains the importance of a 10-0 in basketball and how that impacts the win rate for teams that score a “Kill Shot” or concede a “Kill Shot.” I spent some time a couple weeks ago exploring an adaptation of the basketball “Kill Shot” to a baseball “Killshot” and this will walk through what that ended up being and why it matters.
Intro to Killshot 101
In baseball, a “Killshot” is a single inning where a team scores 2+ runs and the opponent does not score. The killshot is housed in a single inning and not back-to-back half innings. Below are some example box scores to highlight what is a killshot and what is not a killshot.
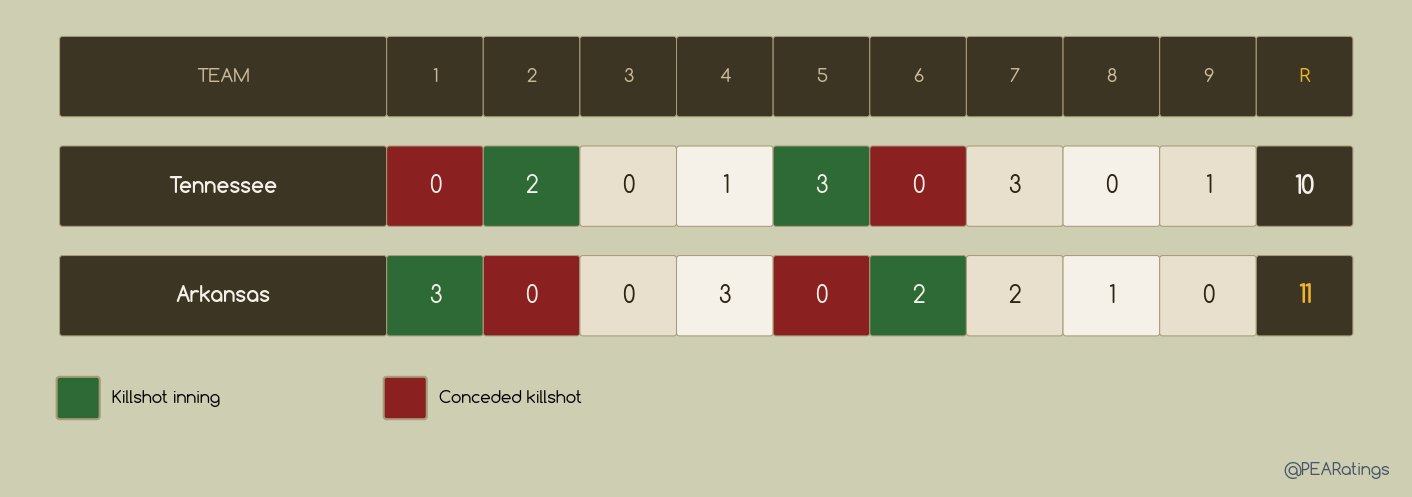
Above is a made up box score between Tennessee and Arkansas. Tennessee had killshots in the second and fifth inning, while Arkansas had killshots in the first and sixth innings. You’ll notice that the fourth inning is not a killshot for Arkansas, even though the inning margin was 2 in their favor. You have to have both the 2+ runs portion and the opponent scoreless portion.
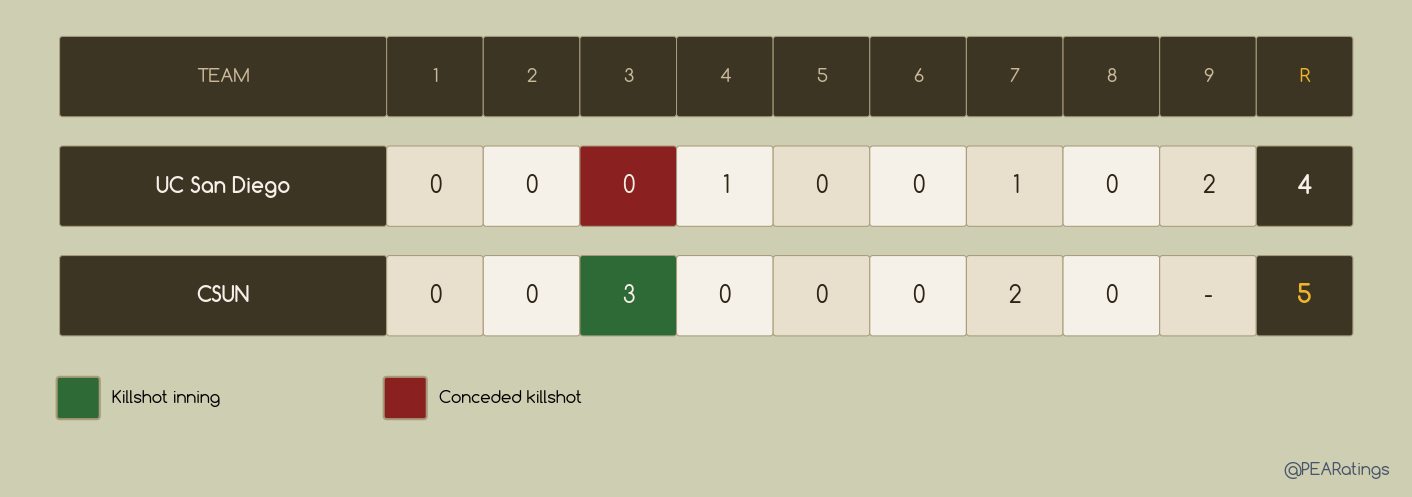
Killshots also only happen in innings that are fully completed. In the above example, UC San Diego does not receive credit for a ninth inning killshot because CSUN did not come up for their ninth inning at bats.
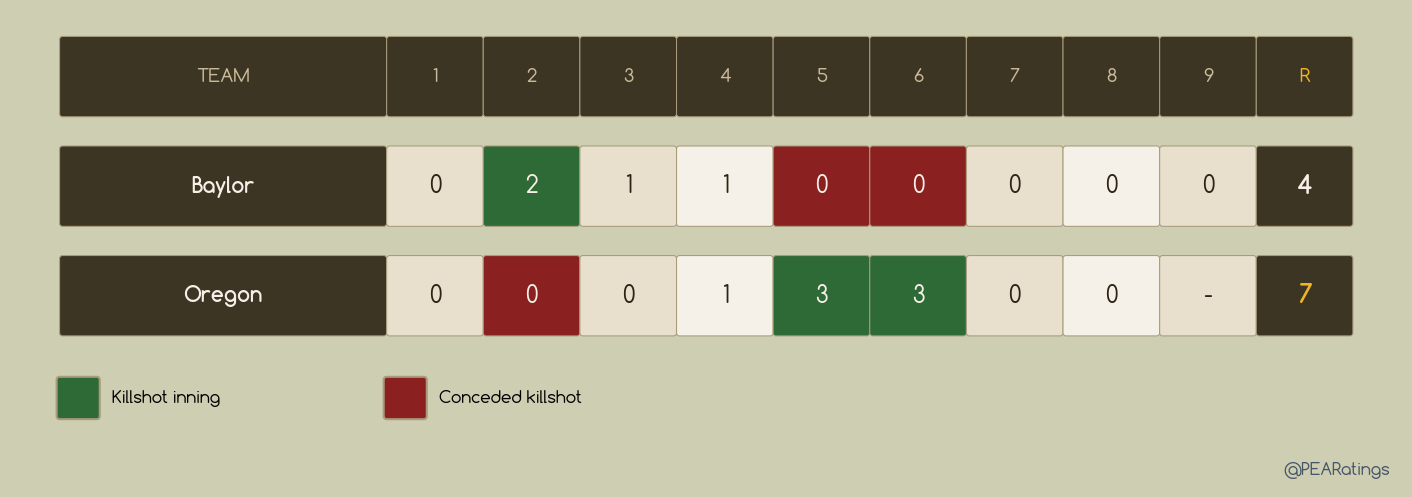
Some more terminology you may hear is a “Spartan.” A Spartan is when a team has back-to-back innings with a killshot, shown above with Oregon having killshots in the 5th and 6th inning. It was named after USC Upstate, as they had the most back-to-back innings with a killshot in 2025.
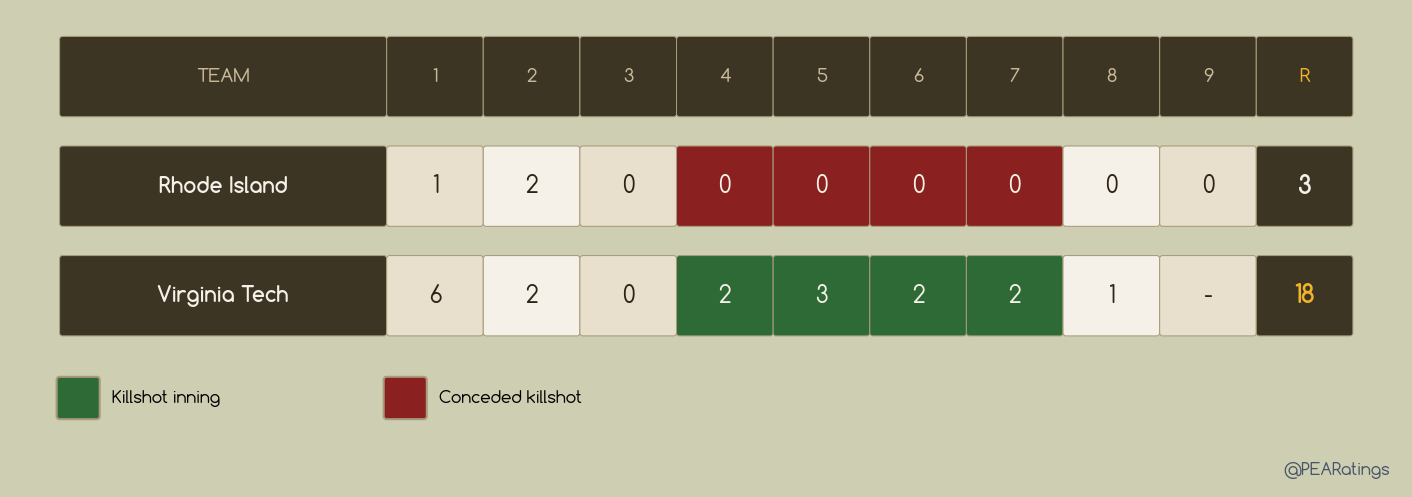
The final nickname for a killshot is a “Beaumont.” A Beaumont is when a team has back-to-back-to-back innings with a killshot, which is shown above with Virginia Tech having killshots in the 4th, 5th, and 6th innings. In this game, Virginia Tech also had a Beaumont in the 5th, 6th and 7th innings. The Beaumont was named after the city Lamar plays in since they had the most Beaumonts in 2025.
Does That Actually Mean Something?
A killshot seems so simple - just score 2 or more runs and stop the opponent from scoring. What does that mean for a teams chances to win a game?
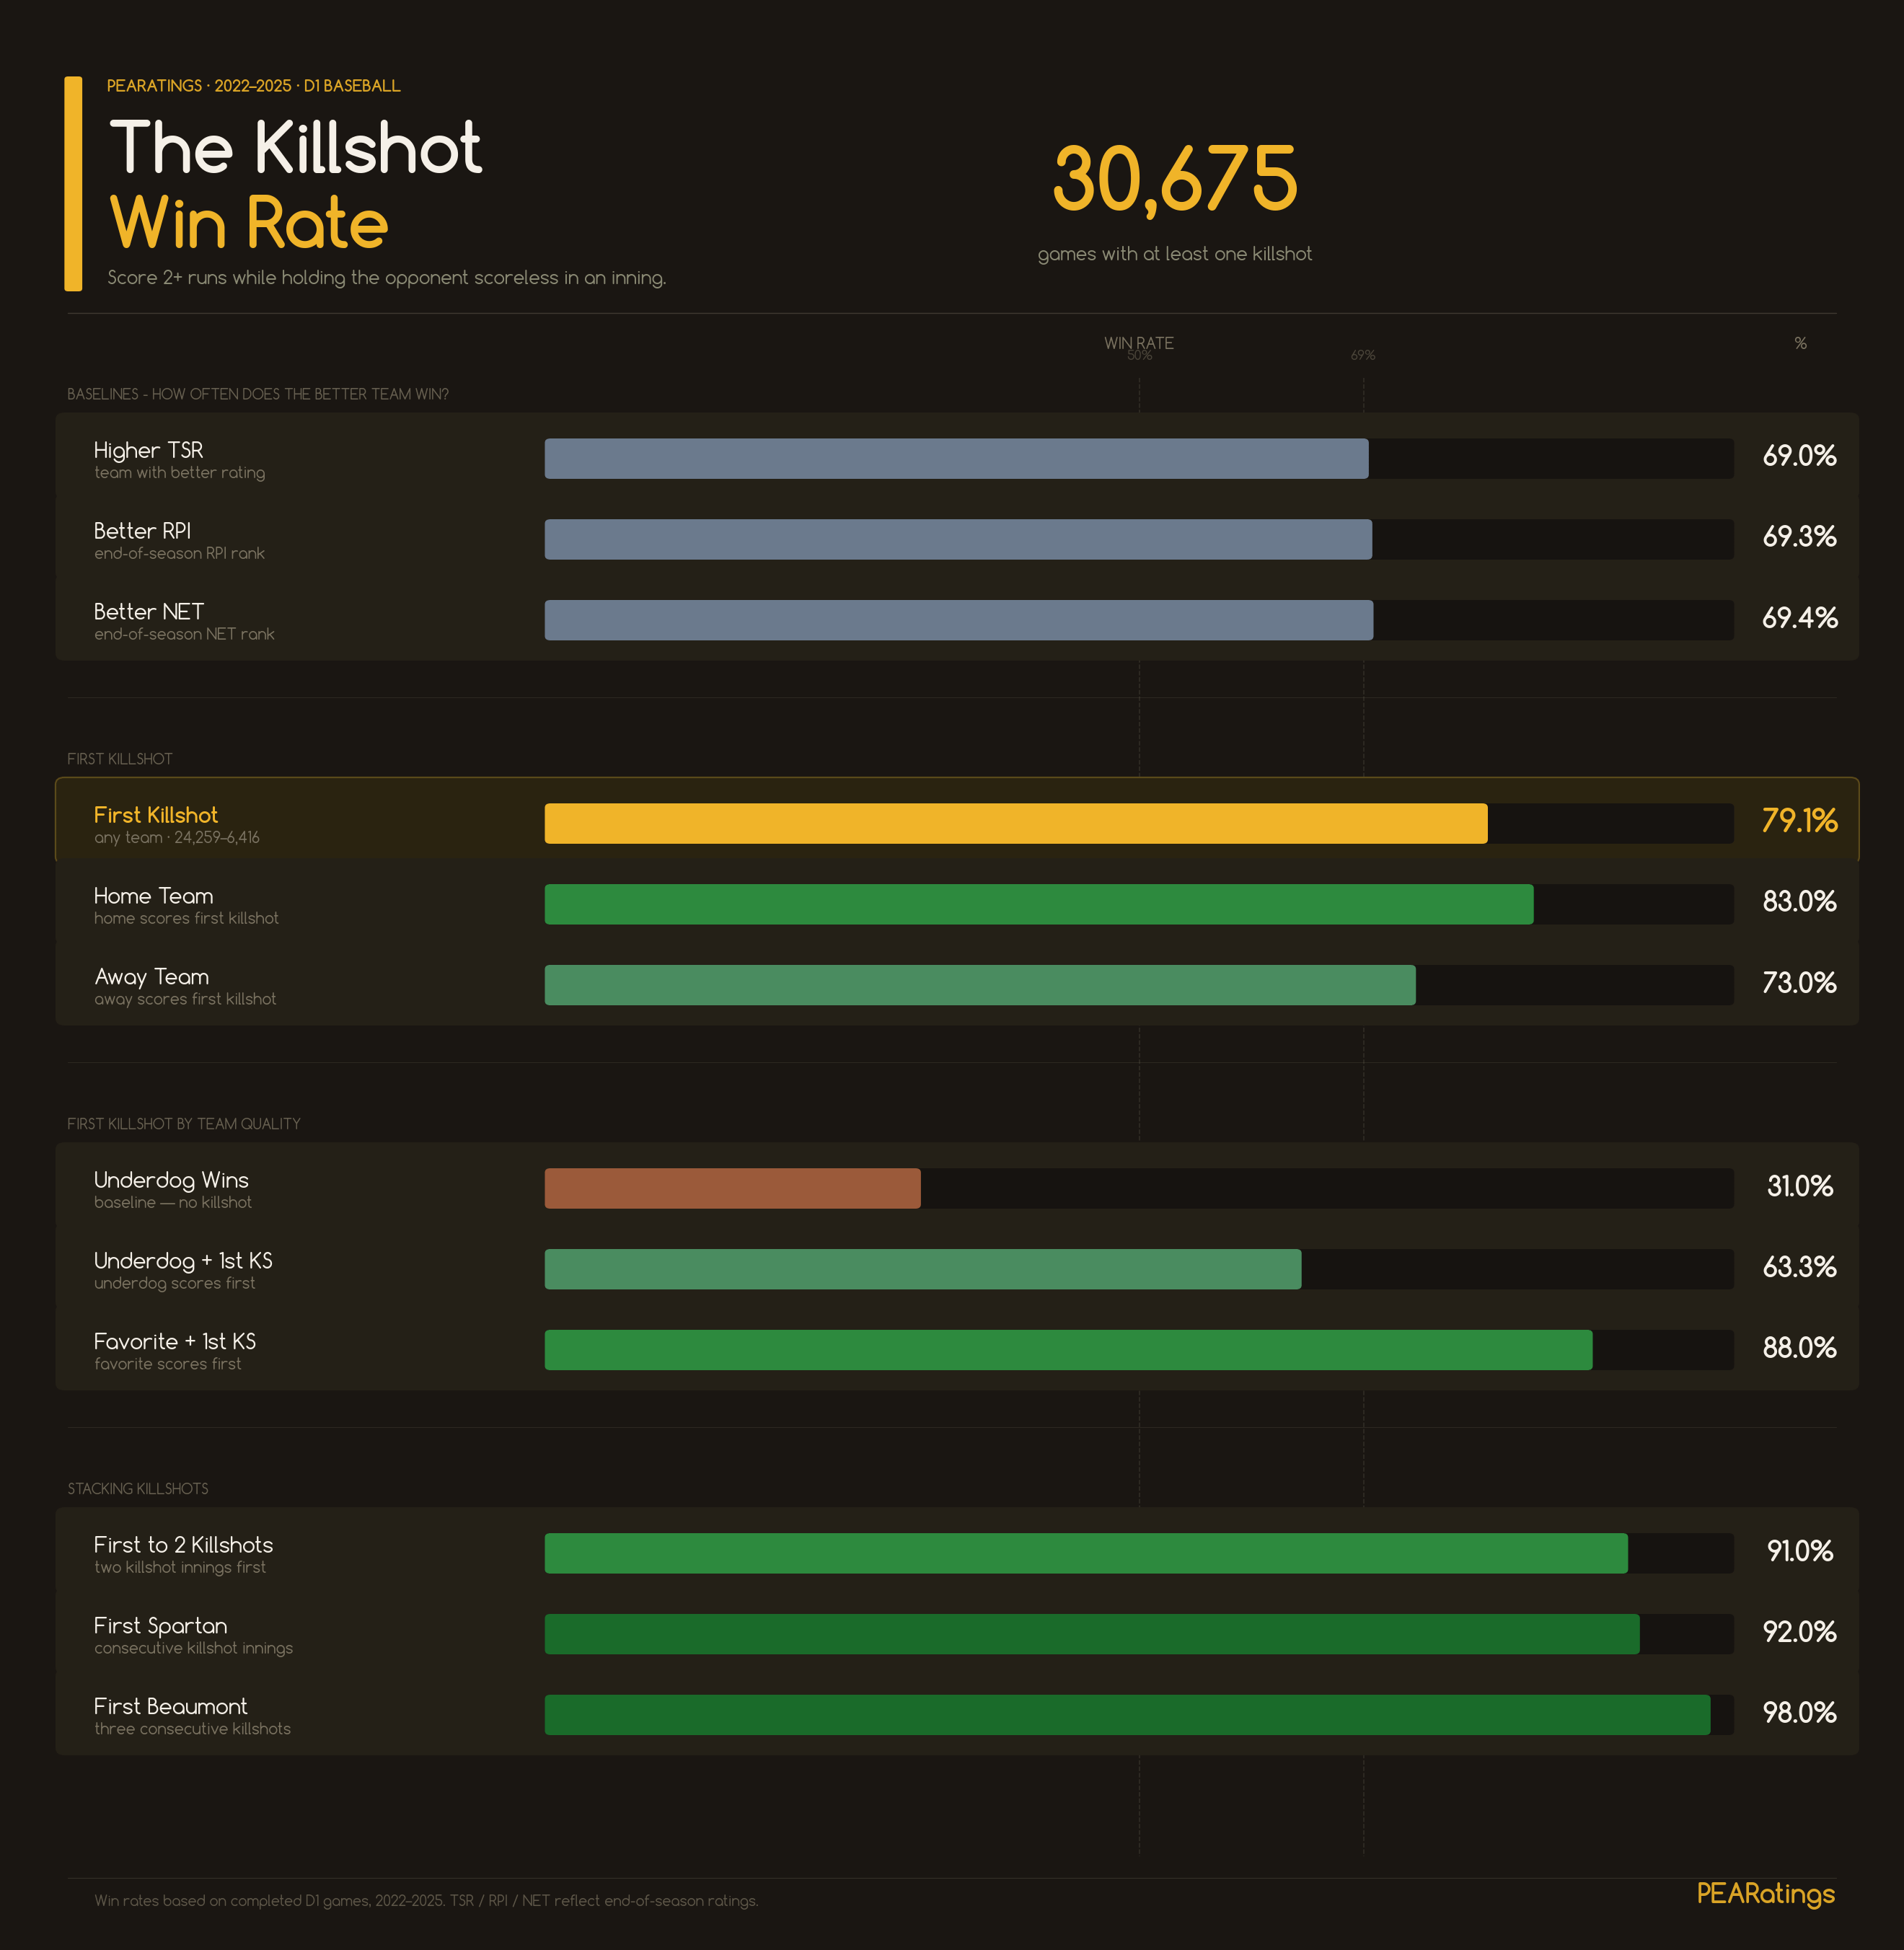
From 2022 to 2025, there have been 30,675 games with at least one killshot. The team who scored the first killshot in the game went on to win 79.1% of the time (24,259-6,416). Home teams with the first killshot won 83% of the time and away teams won 73% of the time.
From 2022 to 2025, the higher-rated team won about 69% of the time. This was consistent across TSR (69.0%), RPI (69.3%), and NET (69.4%). Underdogs, using those metrics as definition, have been winning at a 31% clip. Score the first killshot as an underdog, though, and that number jumps to 63.3%. Score it as the favorite, and you're winning 88% of the time. A pretty powerful indicator when a game is still happening.
It gets more powerful as you add additional killshots into the mix. The first team to get two killshots is winning at a 91% clip. The first Spartan in a game wins 92% of the time. The first Beaumont wins 98% of the time.
Predicting Win Percentage
Not only can the killshot metric provide important context to a game as it is happening, it’s also a pretty good predictor of future success. The team with more killshots at the end of the game won 93% of the time from 2022 to 2025. We can take that idea and use it to rank or project team outcomes.
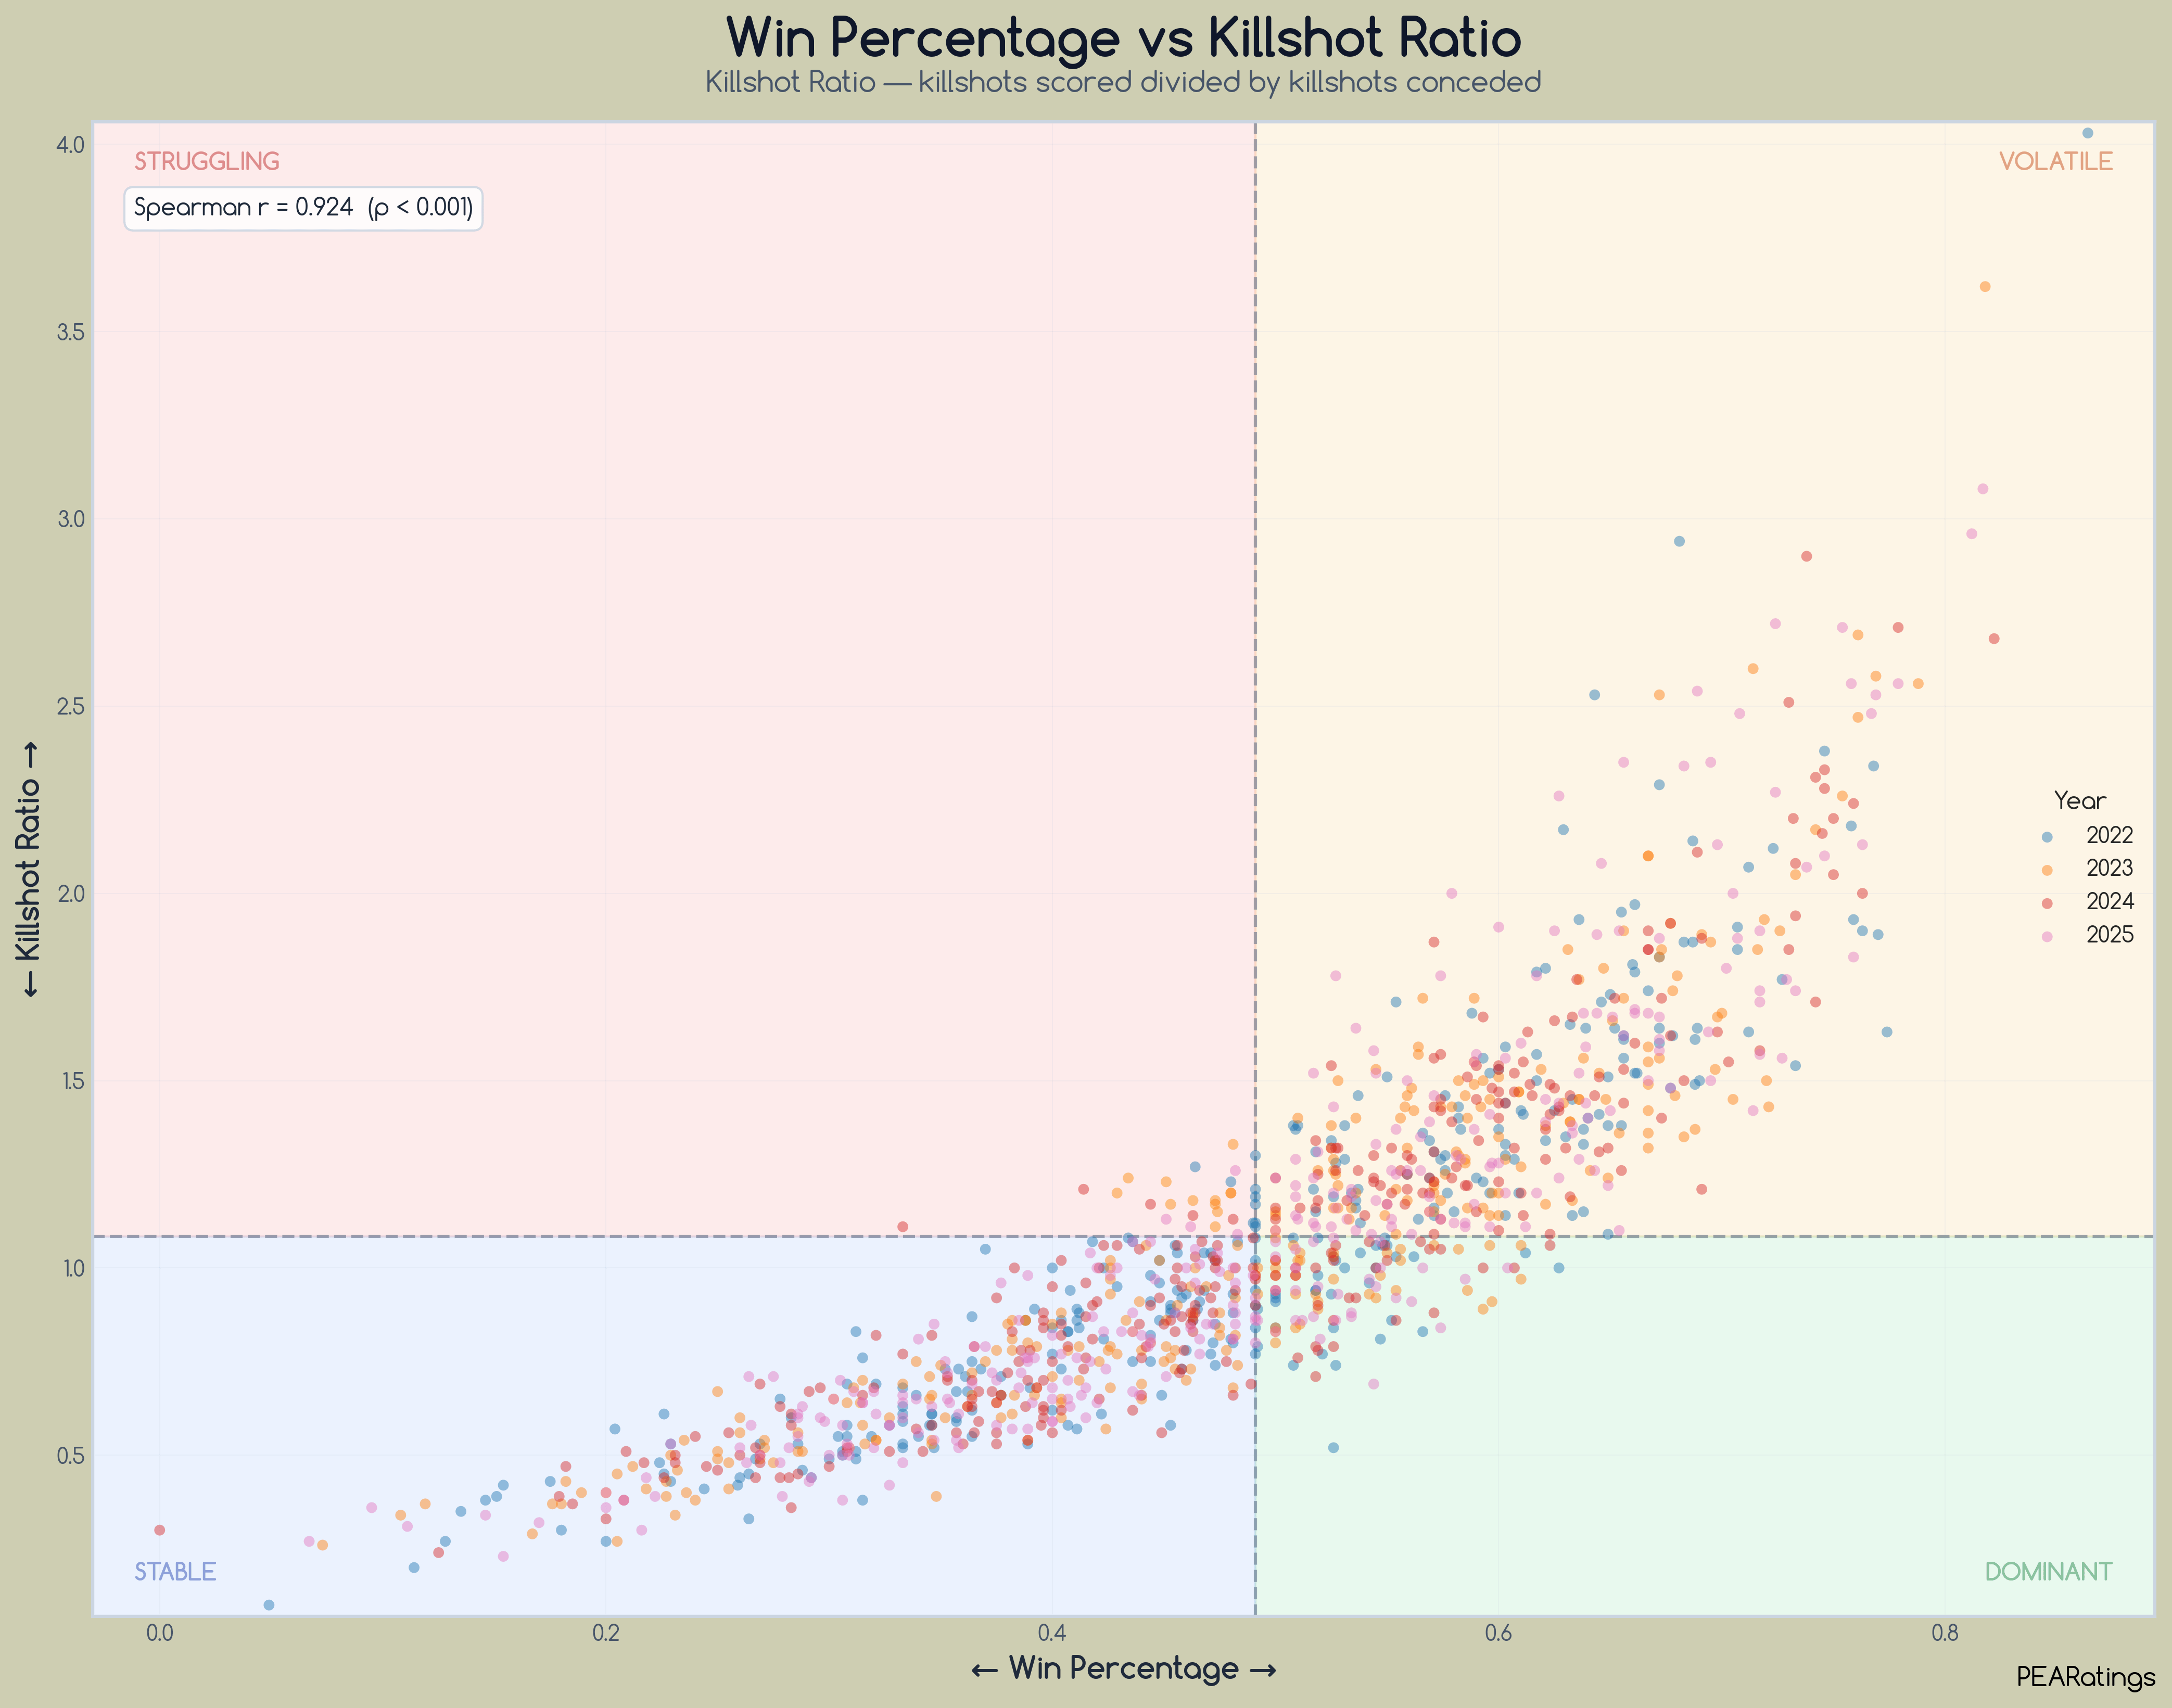
I’ve been “developing” three different ways to use the killshot metric to explain how good or bad a team is. The simplest way is the Killshot Ratio. The killshot ratio is simply the number of killshots a team scores divided by the number of killshots a team concedes. It’s the easiest approach to gaining information about a team from their killshot profile. As you might expect, a team that scores more killshots and limits the amount they give up correlates pretty well to winning. The highest dot on the below graphic, and the only team to ever cross the 4.0 barrier for the killshot ratio, was 2022 Tennessee. They had 129 killshots in 66 games and only conceded 32 of them.
The next view I’ve been working on is Killshot Efficiency. Killshot Efficiency is the percent of runs scored minus the percent of runs conceded via killshots, adjusted for run volume. This one doesn’t provide that different of a view from the Killshot Ratio, as the Spearman r value is identical to the Killshot Ratio value. What it does allow, though, is a breakdown into Offensive efficiency (how well you score it) and Defensive efficiency (how well you defend it). This lets us create the third and final way to characterize killshots - the Killshot Win Percentage.
Much like how Pythagorean Win Percentage takes into account runs scored and runs against, the Killshot Win Percentage takes the Offensive Efficiency and Defensive Efficiency of team and turns that into a projected win percentage. As seen below, it gets a 0.927 Spearman r value, which is slightly better than the previous two metrics.
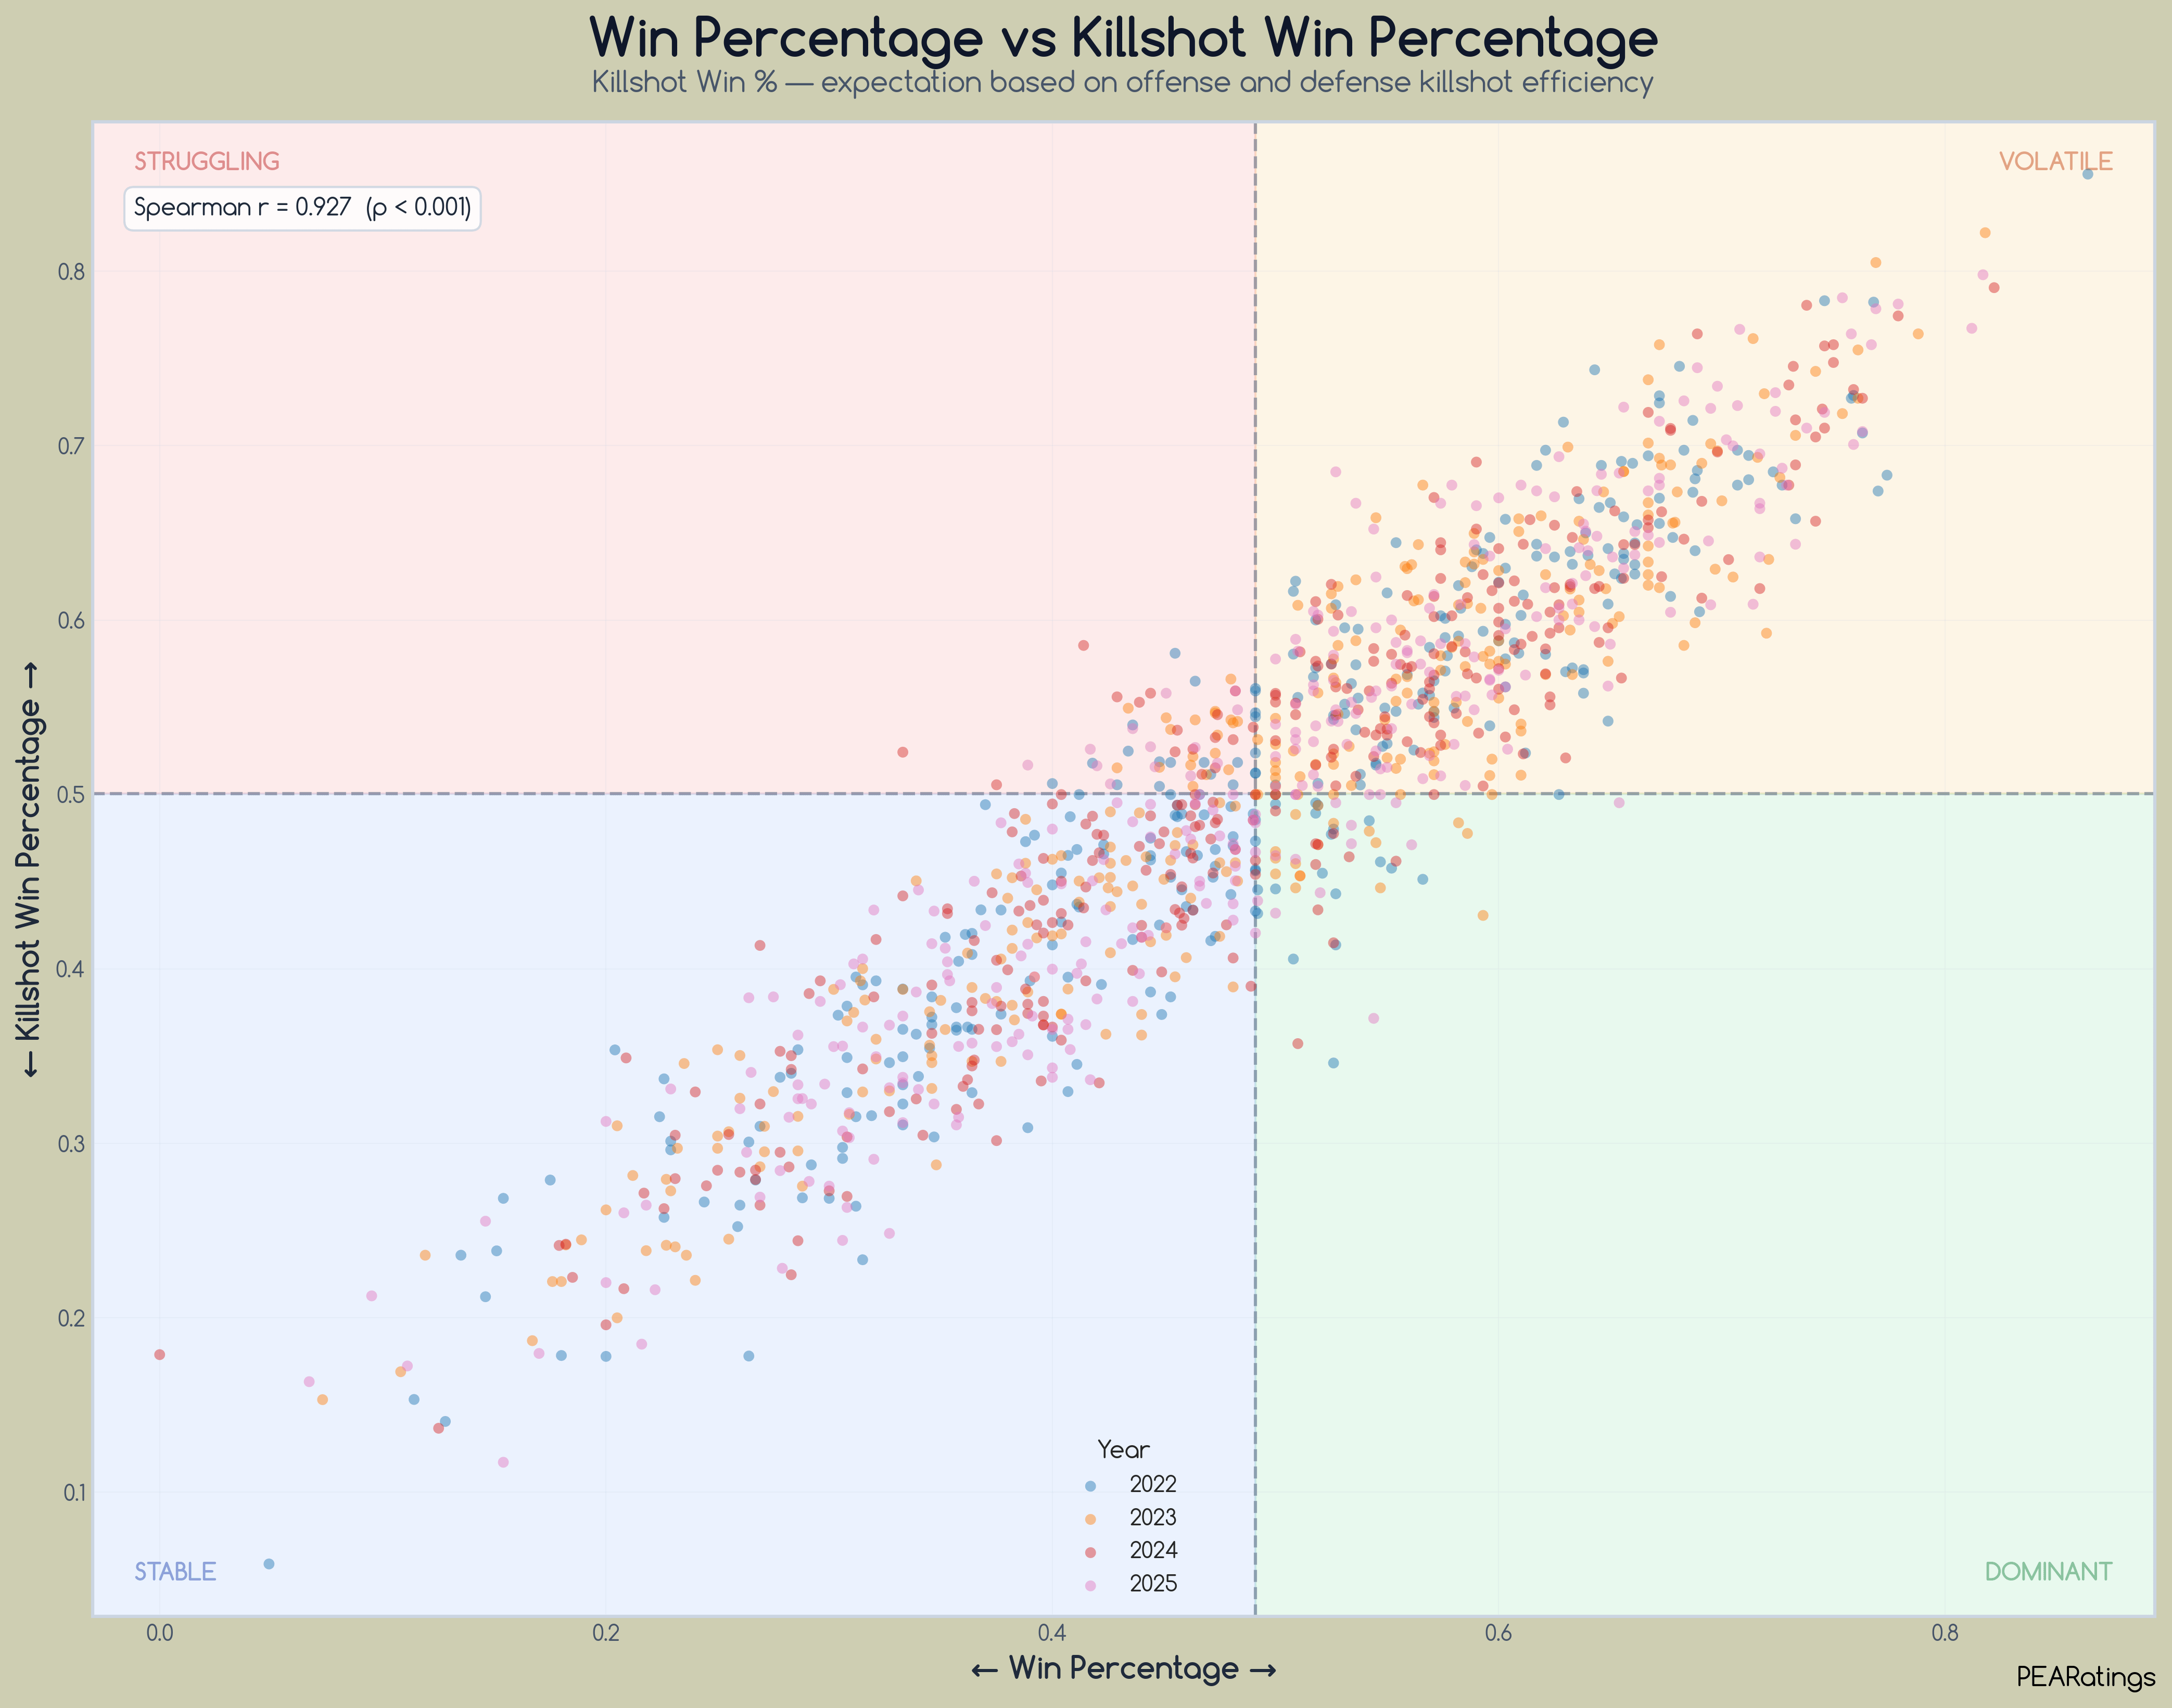
The beauty, though, of the Killshot Win Percentage is in the amount of information it uses compared to Pythagorean win percentage. Pythagorean win percentage accounts for every run scored and every run allowed - and it's slightly better at projecting outcomes, with a Spearman r of 0.945. Killshot win percentage only uses runs from killshot innings, which account for roughly 50% of all runs scored. It uses HALF the information and gets 98% of the predictive power. Below is the correlation matrix between all the stats I mentioned and win percentage.
If you’re going to take anything away from this article, it should be this:
Killshot - 2+ runs while opponent scores 0
Team with first killshot in a game wins 79% of the time
Underdogs with the first killshot win 63% of the time
Spartan, Beaumont are consecutive and three straight innings of killshots, respectively
Killshot Ratio is the easiest way to use killshots to project team strength
Killshot Win Percentage is a great way to project win totals