
What is PEAR?
The Process Behind the Graphics

Hi - I’m PEAR (@PEARatings). I’m a data scientist that loves college baseball. Welcome to my substack. Little awkward for me because I’ve never written anything before but here goes. Get ready for some rambling and nothing making sense as I didn’t proofread this (cause I’m not a writer).
I get a lot of questions about the numbers and visuals I post. Most of my questions (serious or not) are asking for a definition of the metrics. The goal is to give some clarity on that and maybe help some people trust the math a little more.
But first, let me say something. This is my first time and first year doing something like this. I am very nervous about putting this stuff out there. Lots of things will probably change in the coming years. Not everything is perfect. I can’t promise that I do everything correctly. But, as a viewer of many different ratings systems, I wish someone posted their process in one place, which is why I am doing this.
Team Strength
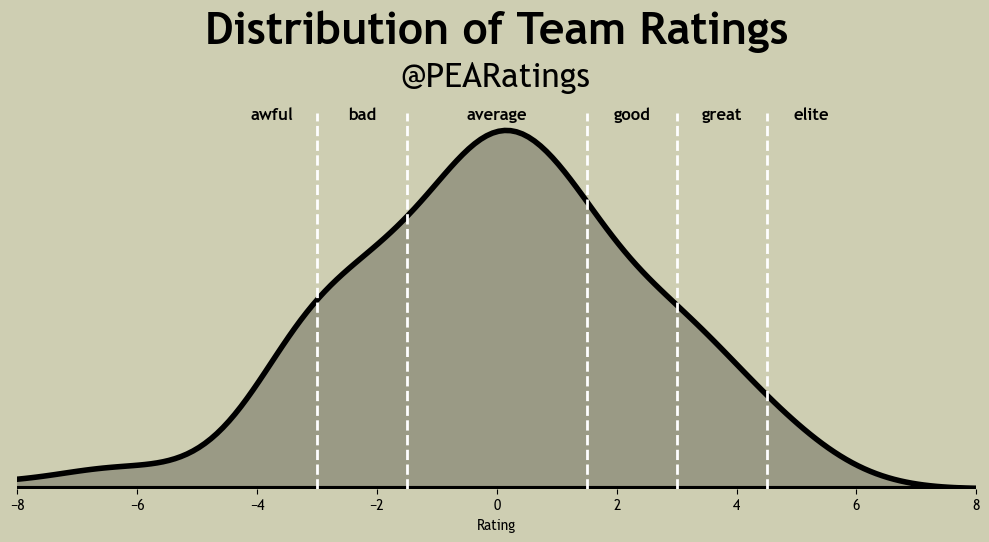
Let’s start with the basic foundation of PEAR - the Team Strength metric. PEAR is built around this idea of assigning every team a single strength value to denote how good they are. Once you have that value, you can compare teams, assign schedule metrics, create win probabilities - the whole nine yards. So, how is it created?
It starts with some stats (duh). The full input dataset has 40 to 50 team level stats that I either scraped or created. Through a (very) lengthy and rigorous testing process, I narrowed that down to 10 stats (with an 11th mystery metric). Those ten stats are:
Fielding Percentage
Left on Base Percentage
On Base Plus Slugging (OPS)
Strikeout-to-Walk Ratio
Walk Rate
WAR
WHIP+ (a normalized WHIP value)
wOBA
wRC+
Ah, but you thought I was done! Not all ten of these stats go into the Team Strength calculation, but they all have a chance to. I have been testing combinations of metrics throughout the season using Differential Evolution to nail down a final, concrete formula. I did not feel comfortable picking a random equation without data to back it up so the final Team Strength formula has not been set in stone, but there are features that are commonly selected. Those are:
WHIP+
WAR
Left on Base Percentage
Fielding Percentage
Pythagorean Win Percentage
The mysterious eleventh metric
The selected metrics are combined using a weighted sum:
And boom, you have a strength metric. It’s really that simple. You’ll notice that I subscribe to the Keep It Simple Stupid way of thinking. Differential Evolution is the star here in selecting the features and the weight each feature should hold. There’s some post-processing manipulation, like ensuring the average team has a rating of zero, but that’s just housekeeping stuff.
Okay - now we have a Team Strength rating for each team based on their own stats. What does Team Strength do? The intent is to answer the question “how many runs better or worse is a team compared to the average team?” For example, South Dakota State ended this season with a Team Strength Rating of -3.17. If the Jackrabbits played the average team, PEAR would expect them to lose by 3.17 runs. If they played a team with a Team Strength rating of 2, PEAR would expect them to lose by 5.17 runs. It is meant to be an intuitive way to compare teams - just find the difference between Team Strength.
You might’ve seen the “Difficulty” path for each team to Omaha on my Twitter/X. That is a sum of the opponent’s Team Strength that each team faced. The total Team Strength Murray State faced playing Ole Miss three times, Duke three times, and Georgia Tech once was 26.98 - extremely difficult!

Team Strength allows me to do a multitude of things, including spreads, win probabilities, strength of schedule, and resume quality. It is the literal foundation of PEAR.
Strength of Schedule
Moving to a hot button topic - Strength of Schedule! I have a lot of feelings about this being used in bubble conversations. The question that PEAR asks for Strength of Schedule is “how would the average team expect to perform against your completed schedule?” The worse the average team expects to perform, the harder the schedule.
To do this, we need the Team Strength metric, the average Team Strength, and a win probability function to project expectations. This function compares Team Strength, adjusting for home field, and converts the difference into an estimated win probability.
Okay, those are the components. The easiest way to describe this is with an example. Say Team PEAR plays this schedule:
Strawberry
Apple
Orange
where Strawberry has a rating of 1, Apple has a rating of -1, and Orange has a rating of 5. Remember, the average team will always have a rating of zero. We now plug these values into the win probability function, which gives us win probabilities:
The average team has a 43.7% to beat Strawberry
The average team has a 56.3% to beat Apple
The average team has a 22.0% to beat Orange
Strength of Schedule is the average win probability in those three games. In the case of Team PEAR, their Strength of Schedule is 0.40, meaning the average team would be expected to win 40% of the games against their schedule. The hardest schedule this year (according to PEAR) was Auburn’s, where the average team would be expected to win 36% of their games. The easiest schedule this year was Delaware State’s, where the average team would be expected to win 68% of their games.
I can maybe anticipate some questions regarding Strength of Schedule:
Are all games weighted the same? Yes
Does home vs. away make a big difference? Around a 5% difference
When is SOS calculated? It’s dynamic, updating every time Team Strength updates
Does it account for injuries? No
Weather? Time of Day? Travel? No, no, and no
Notice - Strength of Schedule has nothing to do with how good you are. Team PEAR could be the best team of all time or the worst team of all time and they would still have the same Strength of Schedule.
Soapbox time. I do not like comparing teams using Strength of Schedule. Sure, it gives you an idea if a team has been “battle tested,” but it lacks a key distinction. Strength of Schedule does not account for how you played. Team A could have the best Strength of Schedule in the country, but going 20-41 against that schedule doesn’t mean you are a good team. Strength of Schedule is a descriptive metric, not an evaluative metric.
A great substitute of Strength of Schedule is Strength of Record, or in PEAR’s case, Resume Quality.
Resume Quality
Resume Quality is an evaluation of how well you performed against your schedule, taking into account how difficult your schedule was. Resume Quality awards you points for beating a team and deducts points for losing to a team. The magnitude of change rests on how the projected 16th host would play against that team. The idea is that only 16 teams have a positive Resume Quality - the 16 hosts.
PEAR modifies EvanMiya's win quality metric for basketball. The rule is you gain (1 - win probability) points for a win, and you lose (win probability) points for every loss. The win probability is based on the likelihood the projected 16th host would win.
Some notes about Resume Quality. Where the game is played absolutely matters. It is more difficult to win on the road, and that is reflected in the win probability calculation. Margin of victory (or loss) is not considered here - win/loss is binary. Every game is weighted equally - even your game against Missouri.
Let’s look at another example with Team PEAR. We have the same schedule as before, but with our game results:
W against Strawberry → 16th-best team had a 72% chance of winning → +18 points
W against Apple → 65% chance → +35 points
L against Orange → 39% chance → -39 points
This would lead to Team PEAR’s Resume Quality of 7.3, which is the average of those three results. As of right now, Arkansas has the best resume quality with a score of 0.08. Norfolk State has the worst resume quality with a score of -0.81. This is intentionally a tough scale - if you’re positive, or close to it, you belong in the hosting conversation.
Can you game this metric by playing weak opponents? Kinda. If you go undefeated (or close to it) against weak opponents, you may have an overinflated Resume Quality because the goal is to punish losses. The flip side, though, is that you get punished HARD for losing any one of those games. It could undo weeks and weeks of progress - just look at Iowa.
Iowa’s losses to Western Illinois, Illinois State, and Washington wiped out weekends worth of progress, which ultimately knocked them out of the postseason.

Why this metric? As I mentioned, Strength of Schedule tells you how difficult the teams you played were, but it doesn’t put into context how well you performed against those teams. Resume Quality fills that gap. It answers the question: “Did you not only face strong opponents, but did you actually beat them?” For a team to reach that #1 spot in Resume Quality, you know that they played a tough schedule AND performed well against it - better than anyone else would’ve.
NET Ranking
Okay - everything talked about so far is not a ranking of who is better this year. Team Strength is who should win, Strength of Schedule is describing your schedule, and Resume Quality is quantifying performance. We need something that combines these three components. Enter NET ranking. NET ranking tries to identify the most deserving teams by creating a blend of resume-based metrics and predictive elements.
NET stands for “New Evaluation Tool,” and it is intended to be an RPI-type metric that removed the some of the things I didn’t like about RPI:
Losing Points for a Win - some teams find themselves in situations where they will lose RPI points even if they win
Gaining Points for a Loss - on the flip side of that, teams can gain RPI points for a loss
Not Controlled By You - a teams own win percentage is only 25% of the formula. The other 75% is controlled by your opponents and their opponents
The main driver of NET is the Resume Quality, which solves the three problems I have with RPI:
Teams will always gain points for a win. Now, that doesn’t necessarily mean you’ll go up in rankings because other teams could gain MORE points.
Teams will always lose points for a win. Again, that doesn’t necessarily mean you’ll go down in rankings because other teams could lose MORE points.
Resume Quality is entirely controlled by you. If you win your games, you’ll gain points. Stack a bunch of wins, you’ll be high in the rankings.
Things that I do like about RPI survived in PEAR’s system, such as home field advantage, rewarding tough scheduling, and the fact that it is a universal baseline for comparing teams.
Resume Quality stands strong on its own, but incorporating both Team Strength and Strength of Schedule makes the NET ranking more well-rounded. It blends performance-based results with forward-looking metrics to give a complete picture of who the best teams are.
So, how do you actually blend these three pieces together? Similar to Team Strength, I didn’t want to just guess, so I used Differential Evolution to find the best combination. At the end of the season, the formula landed here:
Resume Quality accounted for 80% of your NET Score
Strength of Schedule accounted for 12% of your NET Score
Team Strength accounted for 8% of your NET Score
Again, similar to Team Strength, I plan to finalize the formula once I am confident in its ability to evaluate and rank teams effectively.
Okay, I’ve defined PEAR’s NET ranking and what it intends to do. You may ask, “yeah, but how good is it?”
This year, NET correctly selected 32 of the 35 at-large teams in the NCAA tournament.
The team with the higher NET ranking won 64.6% of the time. The team with the higher RPI ranking won 63.3% of the time.
On March 7th, NET had 10 of the 16 Super Regional teams in its top 25 - no other publication had more than 8.
One example from the comparison between RPI and NET: on Selection Monday, Murray State ranked 47th in NET but just 88th in RPI. That’s a 41-spot gap that NET picked up on that RPI completely missed.
NET isn’t just a tweak to RPI - I believe it’s a better system altogether. NET is a culmination of three components aimed at solving some of the main gripes of RPI. It is built on the foundation of team stats and team performance, putting the focus back where it should be: rewarding teams for what they control.
Validation
How do I know that PEAR is healthy? There’s three different things that I check:
Team Strength vs. ELO
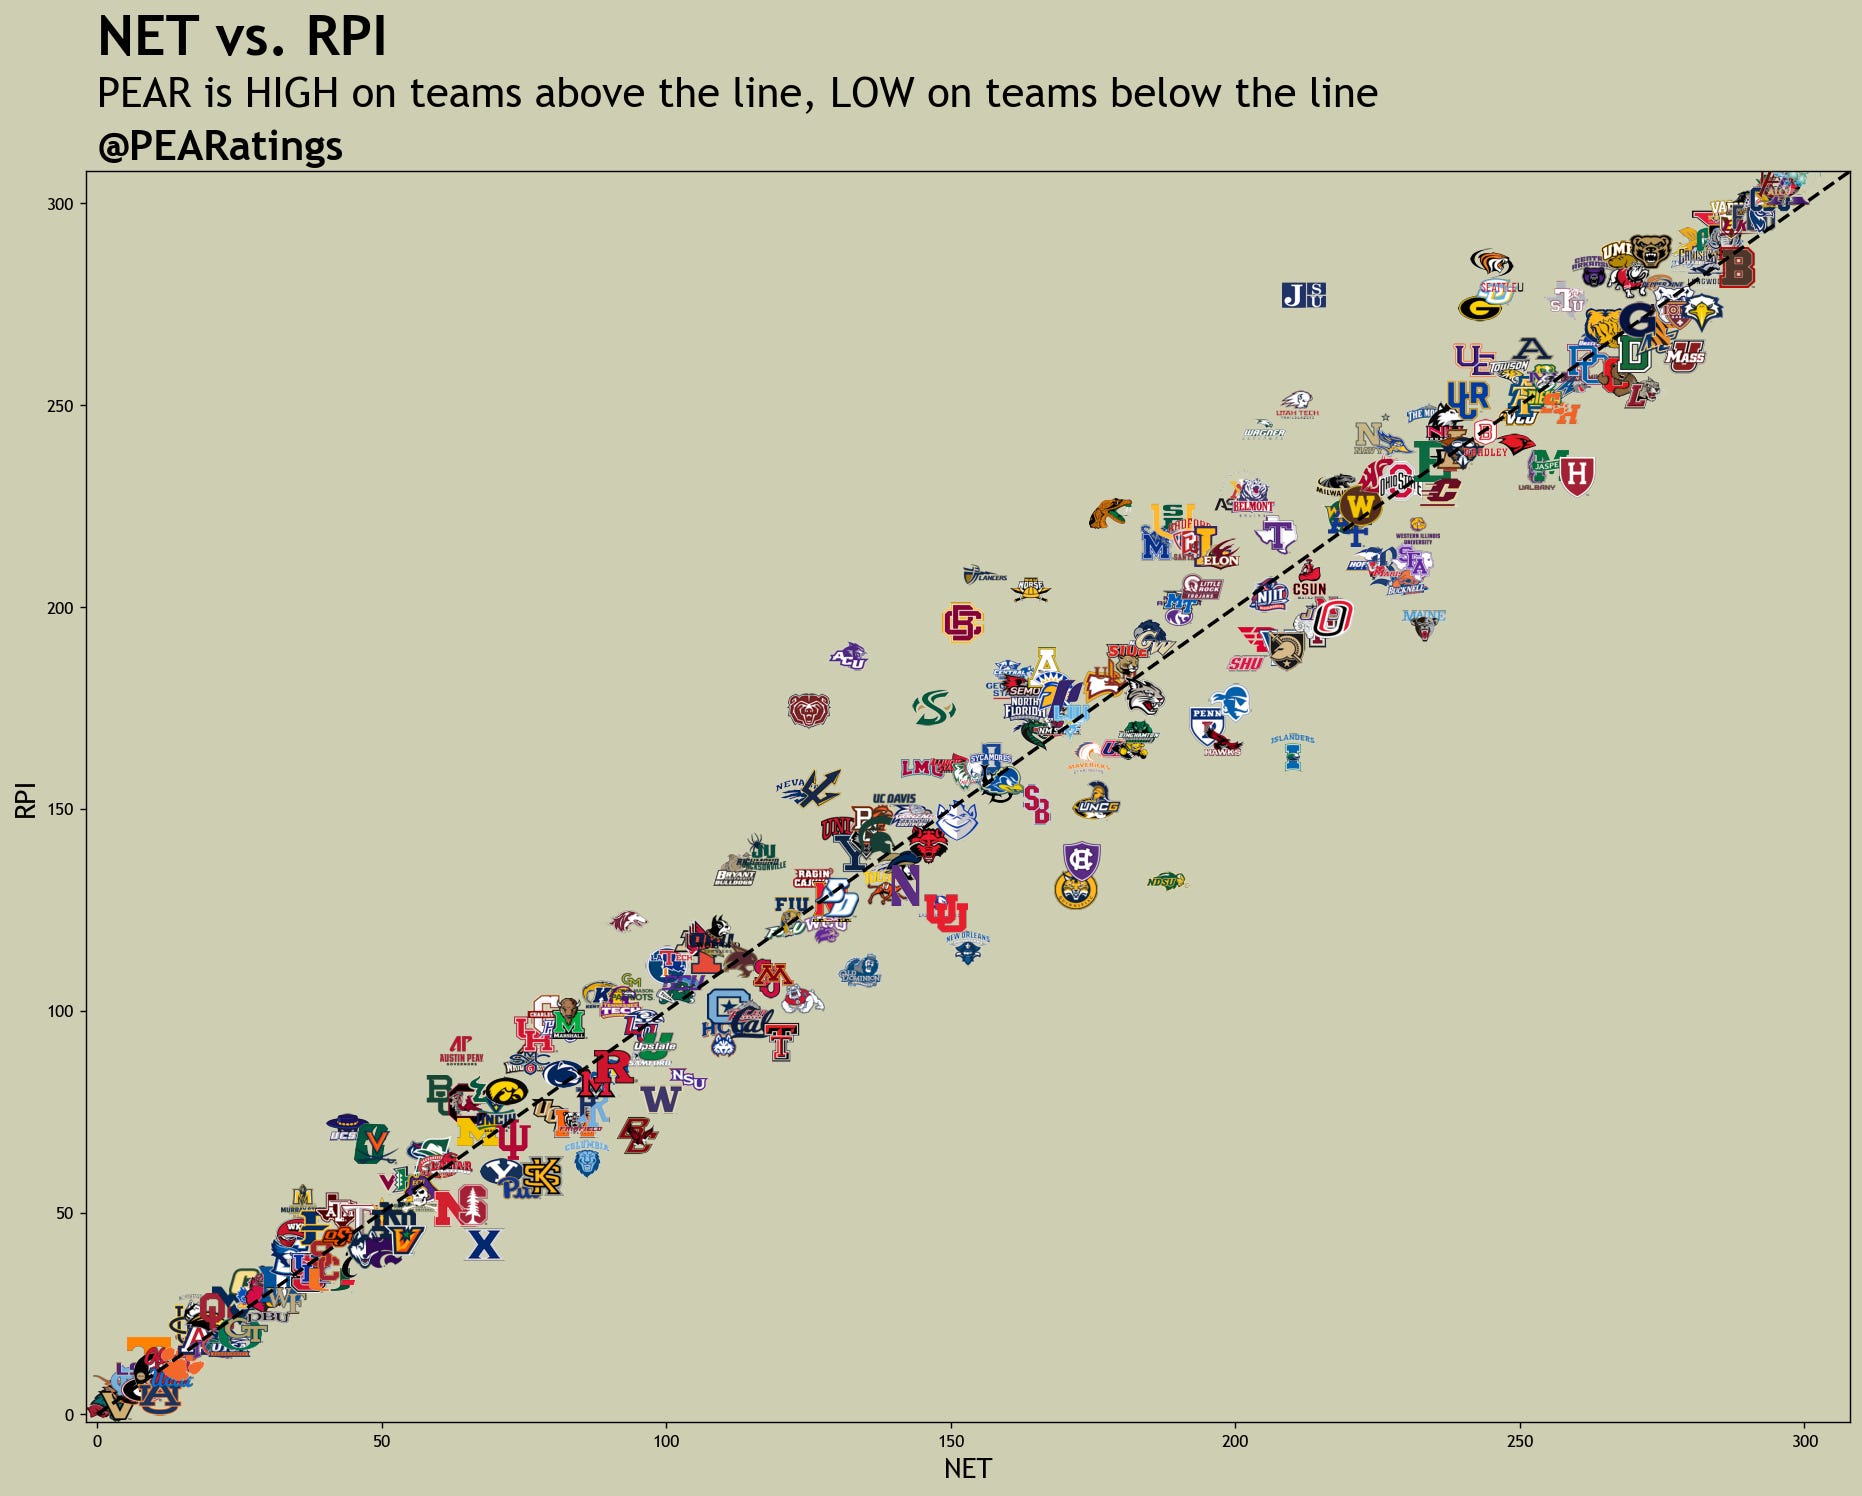
NET vs. RPI
Win Probability vs. Brier Score
The idea is simple: ELO and RPI are widely recognized and respected benchmarks. If PEAR wants to be taken seriously, it should at least land in the same ballpark. To measure that, I use Spearman Correlation to see how closely PEAR’s rankings align with these established systems. So far, Team Strength correlates with ELO at 93% and NET aligns with RPI at 96%. That tells me PEAR is capturing the same general signals, but doing it in a way that’s more intentional.
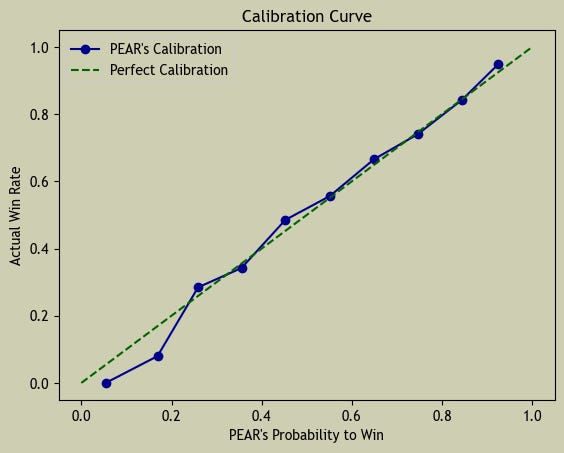
The last thing that I test is the win probability formula, which gives odds of one team beating another and what the projections are built off of. To check how accurate those probabilities are, I use something called the Brier Score.
Think of the Brier Score like a “report card” for predicted probabilities. It compares what the formula expected to happen vs. what actually happened. A lower score means better accuracy. Using the Brier Score helps make sure the win probabilities aren’t just guesses - they’re well-calibrated and reliable.
This season, the formula produced a Brier Score of 0.216, which is strong for a sport as unpredictable as college baseball. For the type of work I’m doing, a strong Brier Score is anywhere between 0.18 and 0.22.
Overall, PEAR does a solid job given it relies solely on free, public data. I don’t have access to premium tools like 643 Charts, 64Analytics, Synergy, or D1 Baseball, and I’m just one person - not a Vegas-level operation. I’m genuinely happy with how PEAR has performed this year.
And there you go - that’s PEAR. As a first-time writer and someone new to sharing this work publicly, putting this out there is nerve-wracking. I probably missed something, made typos, and I’m sure everything makes no sense. If you have any questions, thoughts, or just want more explanation on something, I’d love to hear from you. You can reach me on Twitter/X @PEARatings or drop me an email at pearatings@gmail.com. Thanks so much for taking the time to read this!
As a final bonus, here’s my favorite graphic I’ve made. It’s the distribution of the year-normalized Team Strength ratings for each conference.
